 ARMY
ARMYPacific War (1941): Japan vs United States
1941
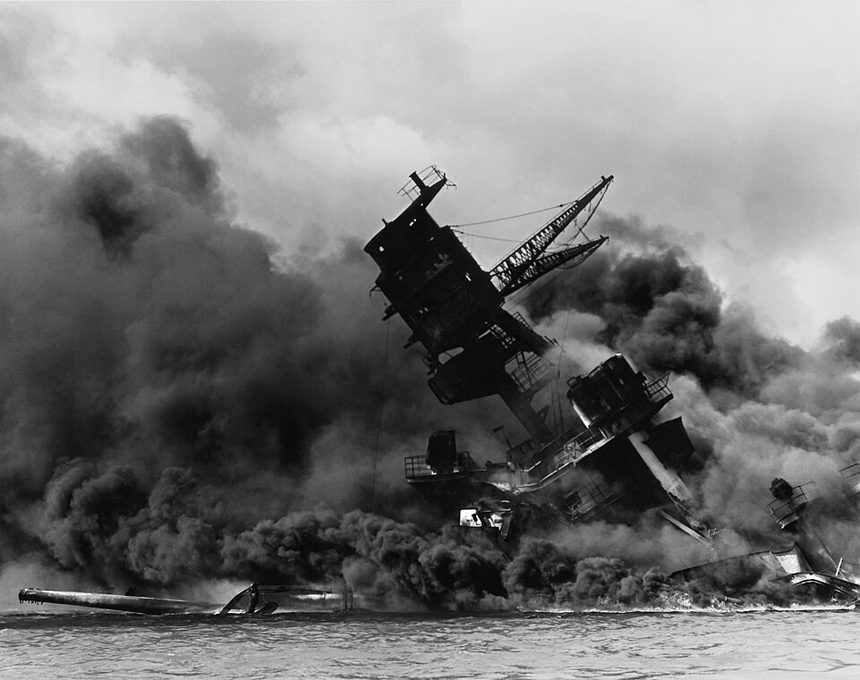
On raw force balance, the model gives Empire of Japan a 54% edge. How that verdict held up against history — below.
The balance of forces
| Empire of Japan | United States | |
|---|---|---|
| 1,700,000 | Personnel | 1,800,000 |
| 1,000 | Tanks | 2,200 |
| 2,400 | Aircraft | 3,000 |
| 112 | Warships | 170 |
| ×1.15 | Quality factor (est.) | ×1.0 |
Elite carrier aviation, night-fighting navy, combat experience in China — versus — Peacetime military just beginning mobilization; vast untapped industry.
What actually happened
Japan opened with six months of stunning victories, from Pearl Harbor to Singapore. But the model's near-parity hides the one variable that mattered: industrial capacity. America launched 17 fleet carriers during the war to Japan's handful, trained pilots ten times faster, and by 1944 was out-producing Japan in aircraft eight to one. Midway broke the elite carrier force in a single afternoon; the rest was arithmetic.
All scenarios
- Operation Barbarossa (1941): Germany vs USSR
- Invasion of Poland (1939): Germany vs Poland
- Battle of France (1940): Germany vs Allies
- Korean War Outbreak (1950): North vs South
- Six-Day War (1967): Israel vs Arab Coalition
- → All scenarios
Figures are approximate campaign-start estimates from open historical sources; the quality factor is our editorial assessment of doctrine and training. Compare these countries' modern armies in the simulator.